
green-ops · systems-architecture · cloud-carbon · carbon-intensity · roi-calculation
Vibecoding for the Planet: Apportioning UK Cloud Carbon Footprints in the AI Era
How compiling thin-stack native binaries offsets the massive grid-scale power consumption of UK data centres.
I kept returning to one number. 5.8 percent.
That is the share of the UK's entire national electricity grid currently consumed by data centres. Not AI specifically. Data centres. The infrastructure we have been building on for thirty years, mostly without thinking about it.
And now we are pouring AI workloads on top of that.
The UK has made genuine progress on renewable generation. You can watch it live on the NESO Carbon Intensity Dashboard. But demand is moving faster than supply. According to the IDCA Global Data Centre Report (2026), the UK's data centre footprint has reached 2.0 GW of continuous capacity, consuming 5.8 percent of the nation's total electricity, and rising. (The IDCA's methodology produces a higher figure than some government estimates; their scope includes embedded and co-located infrastructure that others exclude. The direction — upward, fast — is not in dispute.)
My previous experiment showed that thin-stack native binaries use 30–100x less memory than runtime-heavy alternatives. This piece asks the follow-on question: what does that saving actually mean at grid scale? I've done the calculation. I think it matters. Tell me if I've got it wrong.
The Double Tax: Bloated Footprints vs. Wasted Workloads
The data centre energy profile has two distinct, compounding inefficiencies:
- The Active Bloat Tax (Bloated Code Footprint): The continuous memory and CPU overhead consumed by active services. Runtimes like Node/Bun or the JVM require 30–40 MB of RAM just to sit idle, forcing cloud providers to build and power massive, highly cooled physical hypervisors. In Germany, data centre consumption currently sits around 4% of the national electricity grid — with some projections placing it above 9% by the late 2020s, driven partly by fragmented regional server infrastructure that runs well below hyperscaler efficiency levels.
- The Passive Wasted Workload Tax (The Zombie Tax): The energy wasted keeping idle, unused container instances running continuously. Because heavy runtimes take seconds to boot, organisations cannot scale-to-zero. The IDCA report reveals that 13% of all cloud consumption in mature markets is wasted on "zombie" containers: dormant workloads drawing continuous grid power simply to preserve their memory state.
Thin-stack, native microservices could address both halves: the active footprint shrinks by over 95%, and because native binaries boot in milliseconds, scale-to-zero becomes viable — substantially reducing the zombie tax in services where it is currently prohibitive.
Step 1: The Baseline Saving (Microservices)
In the previous benchmark, I compared a bare-metal Assembly/C++ API server against a TypeScript (Bun) runtime:
- TypeScript Idle Footprint: ~40.4 MB of RAM.
- Assembly Idle Footprint: ~1.37 MB of RAM.
This represents a 96.6% RAM reduction per instance. When deployed on virtualized servers, memory allocation is the primary pricing and hardware provisioning constraint. Compressing the software footprint directly reduces the number of physical host servers that cloud providers must keep powered on and cooled 24/7/365.
Step 2: Apportioning the Carbon Grid (NESO CKAN API)
To verify and claim these carbon savings, you need to track them. The UK's National Energy System Operator publishes real-time and historical grid data via the NESO CKAN Datastore API. Using dataset 0e5fde43-2de7-4fb4-833d-c7bca3b658b0, you can fetch live national carbon intensity rates to compute actual operational footprints:
Carbon Footprint (gCO₂e) = Energy (kWh) × Carbon Intensity (gCO₂e/kWh)
- Running a bloated service in the UK during peak coal/gas backup generation multiplies your footprint.
- By fetching live NESO intensity, you can schedule non-urgent AI workloads during periods of high renewable output (intensity index: LOW, e.g. 49 gCO2e/kWh).
Step 3: The Micro, Middle, and Macro Offset (UK Projections)
How does the math scale across different organisation sizes when offsetting the upfront token cost of AI generation using live UK carbon metrics?
| Scale | Description | Upfront AI Cost (CapEx) | Annual Cloud OpEx | Annual Carbon Impact (Live API) | Payback Period |
|---|---|---|---|---|---|
| Micro | 10 services (Startups/SMEs) | ~$0.03 | $0.53 (Assembly) vs. $15.70 (Bun) | ~0.86 kg CO₂e Saved | 15.8 Hours |
| Middle | 1,000 services (Mid-Market) | ~$2.75 | $53.30 (Assembly) vs. $1,570.63 (Bun) | ~107.31 kg CO₂e Saved | 15.8 Hours |
| Macro | 100,000 services (Enterprise) | ~$275.00 | $5,330.00 (Assembly) vs. $157,063.00 (Bun) | ~10,731.00 kg CO₂e Saved | 15.8 Hours |
At a national scale, optimising 25% of the UK's optimisable data centre footprint (500 MW) by converting bloated microservices to compiled architectures yields 100 MW of continuous power reclaimed, saving 0.29% of the entire UK electrical grid and preventing over 40,000 tonnes of CO2e from entering the atmosphere annually, while saving over $150,000,000 in energy bills.
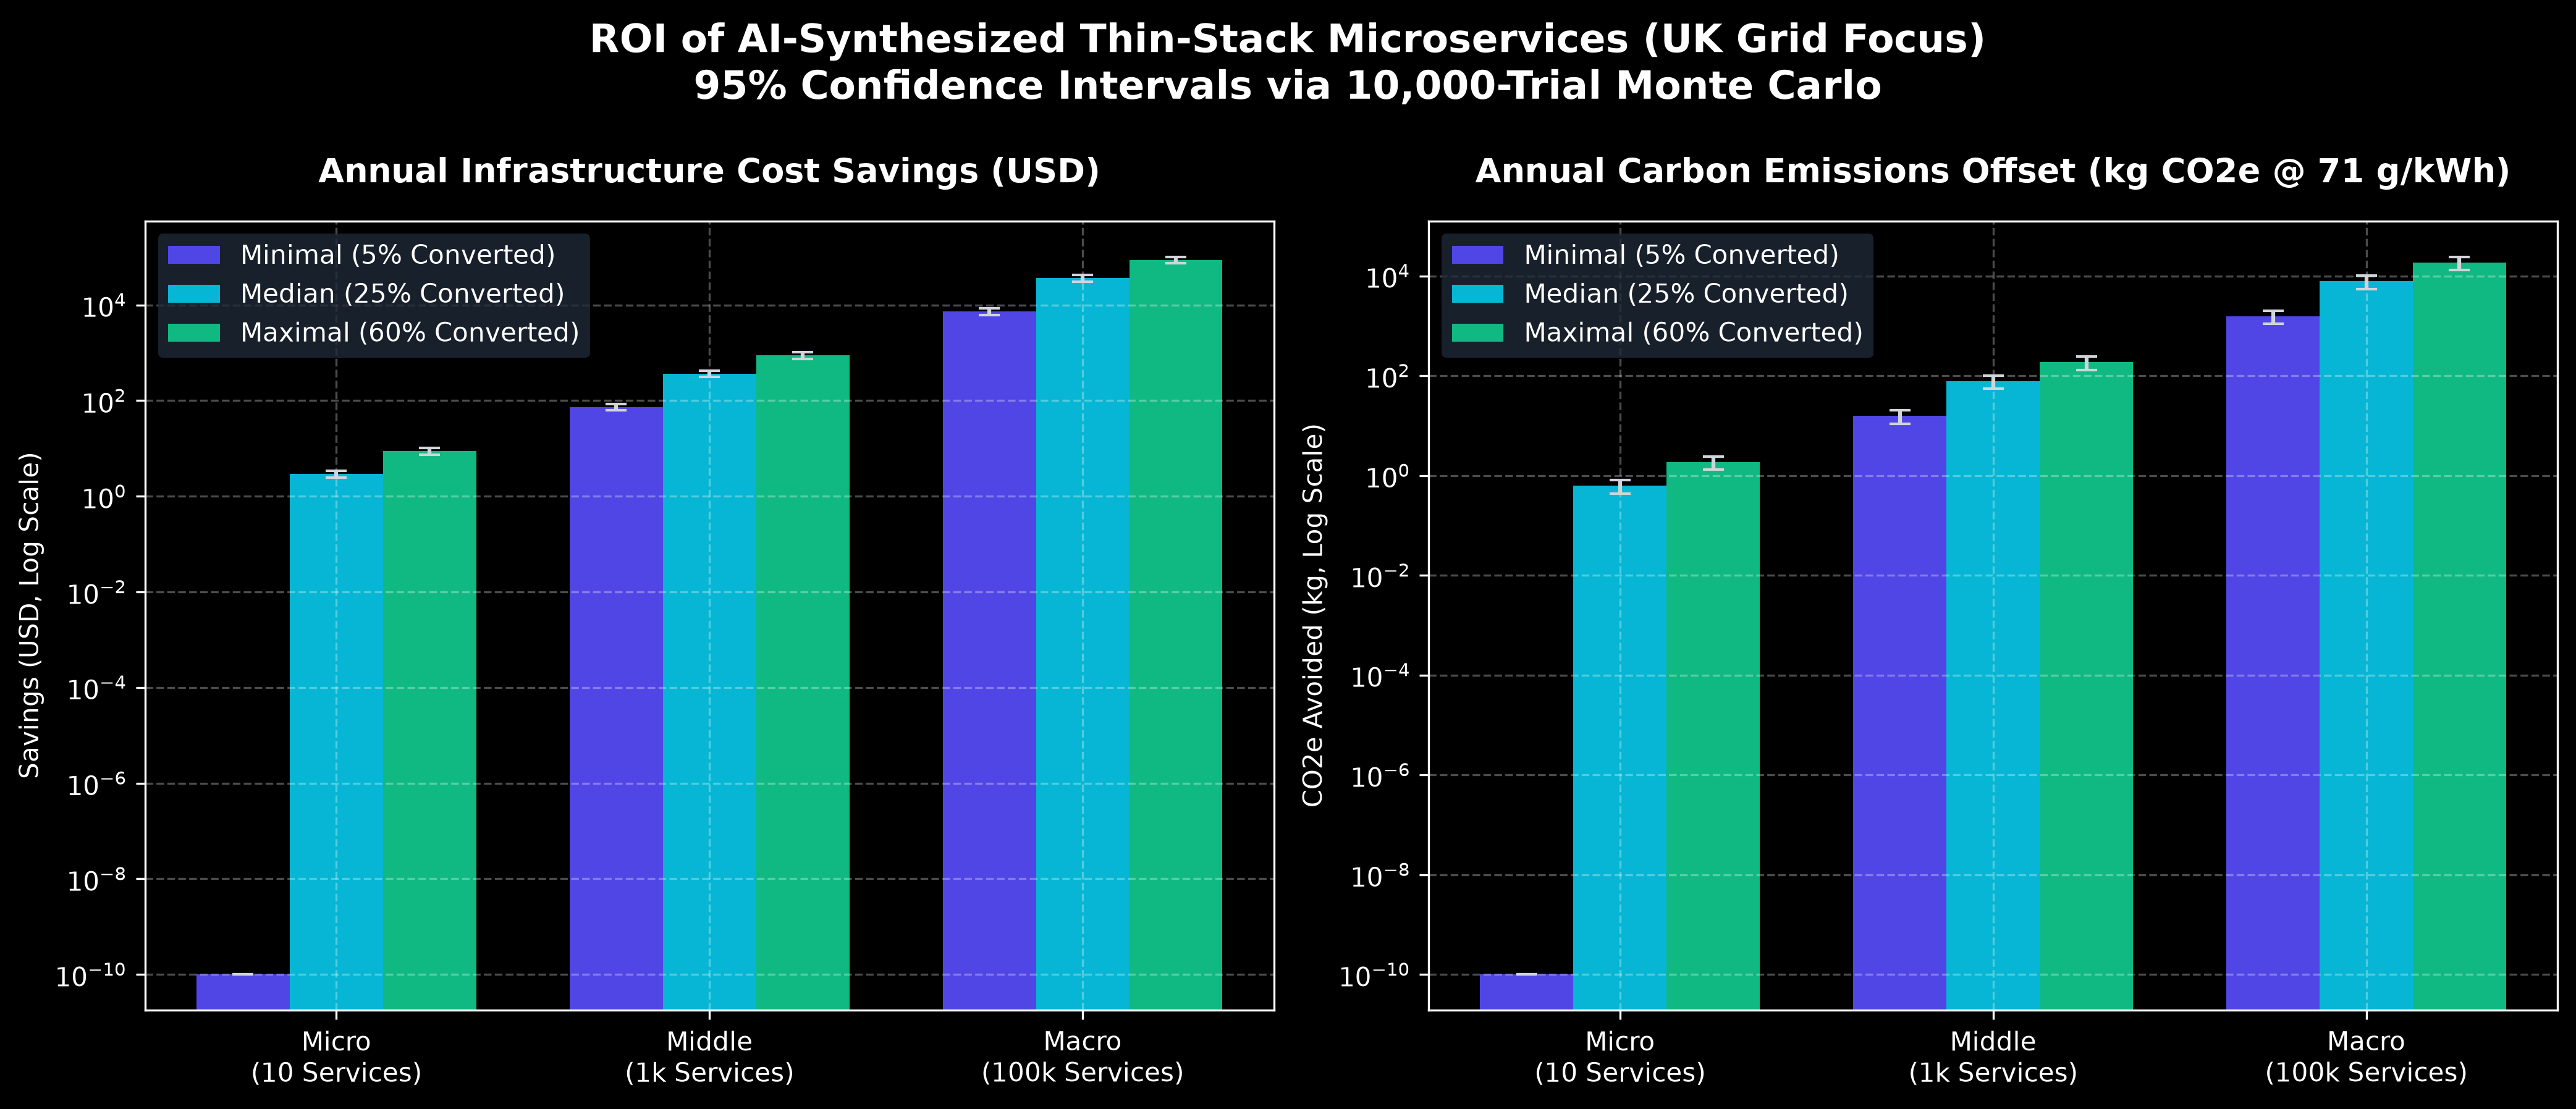
Note: the ROI chart uses a logarithmic scale. The cost differences between micro, middle, and macro implementations span four orders of magnitude; a linear axis would make the smaller values invisible. The payback period is identical at each scale because the model scales linearly — it is a unit ratio of generation cost to operational saving, not a compounding calculation. Real payback depends on utilisation rates and instance pricing.
The 2030 Outlook: AI Agent Proliferation and the Grid Wall
Projecting forward based on the IEA Electricity Report:
- The Grid Share Double: By 2030, global data centre energy consumption is projected to double, and AI-focused workloads specifically are expected to triple. In the UK, this pushes data centre grid consumption from 5.8% to over 11%, matching the current bottlenecks already visible in Germany.
- The Rise of the AI Agent Fleet: Right now, digital workloads are transient and driven by humans clicking pages. By 2030, the web will be dominated by autonomous AI agents running continuous background loops. The shift from "on-demand" human interaction to "always-on" machine processing will amplify active memory footprints exponentially.
- Stewardship vs. Expansion: Stay on the unoptimised thick stack, and this expansion adds pressure on grid capacity — including the fossil-fuel backup generation that still fills gaps when renewables are insufficient. Shift to compiled, scale-to-zero micro-binaries, and a 2–3x workload increase might be absorbable within current national grid headroom. That is not certain. But it seems worth testing the hypothesis before building new capacity to absorb inefficiency we chose.
Total Cost of Ownership (TCO): The Missing Services
It is important to remember that developer time is not free, and LLM API calls add up. A complete TCO of this approach must account for the supporting engineering loop:
- AI Code Generation Fees: API calls for initial synthesis, multi-language translation, and formatting tests.
- Safety & Audit Labour: The human audit pipeline. As the security review showed, AI-generated Assembly is prone to "Security Theatre" and requires manual oversight to prevent memory safety vulnerabilities.
- CI/CD Pipeline Overhead: Re-building and testing native binaries across multiple system architectures (x86_64, ARM64) to ensure cross-compatibility.
I think the case here is genuinely compelling, but I've made assumptions worth testing. If the grid intensity figures don't hold in your environment, or the 13% zombie container figure looks wrong for your platform, I'd like to know. With AI handling the bulk of the writing, we could redirect engineering budgets toward auditing and architecture at a scale that was never previously viable. That seems worth examining honestly.
The full calculations, source data, and methodology are at github.com/ShadowRustRuby/thin-stack-benchmarks. If the grid intensity assumptions are wrong, or the zombie container figure doesn't hold for your platform, or you have better data on UK data centre consumption — that is what the issues tab is for. I genuinely want to know where the model breaks.